How do Industrial Tech founders recognize Product-Market Fit?
Part 2: The analytical and quantitative perspective
By Ingo Fehr and Gregor Haidl (both Investment Managers)
Supported by Yann Fiebig (Senior Investment Manager), Fabian Hogrebe (Analyst), Dr. Andreas Olmes (Principal)
“Are there any objective criteria or KPIs that can indicate that my start-up is on a good way to reach Product-Market Fit?” After dealing with the emotional perspective of founders when Product-Market Fit has been reached, this second blog post is dedicated to the quantitative-analytical perspective on Product-Market Fit. We hope the indicators presented in this article help you to assess and improve your own Product-Market Fit.
We were inspired by a great article of Christoph Janz’s about criteria and indicators he found useful for software as a service companies (SaaS) . To our knowledge a similar set of criteria tailored for Industrial Tech Start-ups has not been published before.
Product-Market Fit: Criteria matching with the common B2B sales process for industrial tech start-ups
The most interesting finding we had during our
discussions about these criteria was, that there are good indicators in all maturity levels. They work for
Industrial Tech companies although tough and long B2B sales cycles exist.
In the following figure we summarized the indicators
we found to be useful depending on the actual maturity of a product or company:
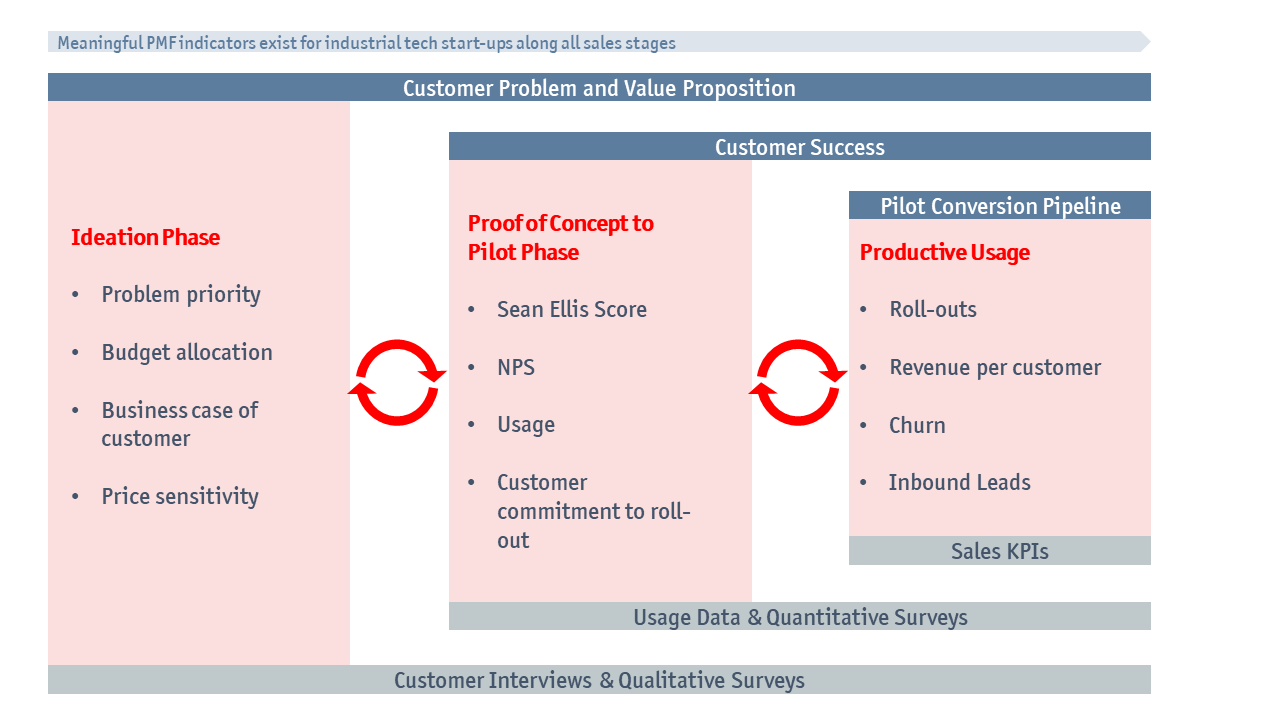
You can think of it as a sales funnel: Many ideas
enter from the left, are iterated along the customer discovery process and most
of them die. If you’re lucky there will be at least one idea/product making it
to the right side and achieving Product-Market Fit.
It’s important to understand that albeit the B2B sales
process is a linear, most companies need to re-calibrate their product-market
fit and even undertake pivots or restarts in later phases.
That’s why you shouldn’t stop using the early
indicators as customer insights evolve over time.
Product-Market Fit Criteria for Industrial Tech: The Deep Dive
Let’s dig a bit deeper into why Industrial Tech with
B2B sales is special. In many cases you must take several steps with a customer
before reaching productive use of your product (and high revenues with this
customer). We found these 4 steps to be adequate for most of our portfolio
companies:
- Ideation Phase
You show and demonstrate your idea to a customer. His main question is “could this be a potential solution for me at all?” - Proof-of-Concept (PoC) to Pilot Phase
- You demonstrate the functionality of your product/MVP in a limited (lab) experiment in a controlled environment. Your client is answering the question “Does this work?”
- Your client is testing your product to a limited extend (only one team, only one site, a small subset of employees, …). His question is “How well is this working under real conditions in my company?“
- Productive Usage
Your client uses your product on a larger scale. We like the term roll-out for the beginning of this phase. Unless another product pops up that solves his problem much better, he will most probable stay a loyal customer for a long time.
Ideation Phase: Customer Problem and Value Proposition
| KPI |
Weak Product-Market Fit |
Strong Product-Market Fit |
| Problem priority |
Fuzzy and high-level description of industry challenges. “Let’s be innovative and try something new.” In reference calls customers mention low price or great collaboration with |
Customer is able to precisely describe his specific problem on a root cause level and is aware of the impact on his companies’ P&L. There is urgency to solve the customer’s problem and he often tried other competitive solutions already without satisfying result. In reference calls, customers are able to clearly describe why the start-up’s |
| Budget allocation | Innovation budget | Business unit budget |
| Business case of customer |
There is no clear, well-reasoned, detailed cost calculation of the customer’s business case. When considering all new pains (e.g. training of employees) only incremental benefit of the start-up product remain. |
Clear, detailed, well-reasoned or even validated business case calculation exists. Benefit of the product is at least 3x higher than the associated costs including any new pains. Customers agree to the calculation method and assumptions. |
| Price sensitivity |
High price sensitivity. Most extreme case: customer wants to try product, only if it is free of charge. |
Low price sensitivity due to the high value of the solution for the customer. founders experience real bargaining power. Customers are willing to accept almost all conditions due to fear of losing the future PoC/Pilot to a competitor. |
Even if you just started your company, on day zero, you can focus on certain indicators to find out, if you are on
the right way. You don’t need a MVP or even a product in order to find out how
pressing and burning your potential customer sees the problem that you aim to
solve. Again, these indicators stay valid in later phases as they are
foundation of Product-Market Fit. Compared to the customer success category,
these indicators are more qualitative. Therefore, mainly customer interviews
& qualitative surveys can be used.
Proof of Concept to Pilot Phase: Customer Success
| KPI |
Weak Product-Market Fit |
Strong Product-Market Fit |
|
“Sean Ellis” Score |
None/Few of your customers would be very disappointed, if they could no longer use the product -> nice-to-have |
>40% of your customers would be very disappointed, if they could no longer use the product |
| NPS |
NPS of 0-10 or lower. Product is not actively recommended by the current customers to potential customers. |
NPS of 10-20 or higher. Users recommend the product through word-of-mouth to others. |
| Usage |
Most customers don’t use the product as frequently as you’d expect it. |
Most customers use the product as frequently as you’d expect them to use it (or even more) based on the use case. |
|
Customer commitment to roll-out |
It stays unclear how and when a larger rollout will take place. Customers don’t stick to initial plans and timelines. |
Customers agree early on the criteria (target KPIs) that need to be fulfilled and commit to a clear roadmap to rollout. Timelines and plans are met by your customers. |
We found the customer success criteria to be the best indicators for
large roll-outs in later stages. Even in pilots or PoCs you can find out, if the users
engage with your product and most importantly if they are not willing to give
it away again. To measure these criteria, you must communicate with your
customers. Interview them, do surveys with them and obtain usage data! Ask
“Why?” several times to find out root causes and understand why product is so
effective. These criteria help you in later phases to detect problems in your
sales performance, killer-features and room for improvement.
Productive
Usage: Pilot Conversion Pipeline
| KPI |
Weak Product-Market Fit |
Strong Product-Market Fit |
| Roll-outs |
Decisions take forever. Only pilot groups are testing the product. Sales Cycles are much longer than expected. |
Widespread productive use of the product. Pull from other people outside of the pilot groups. Sales cycles are not a problem. |
|
Revenue per customer |
Customers are paying insignificant amounts relative to their size. You can hardly cover your high B2B sales costs. |
Customers are paying a significant amount of money relative to the size of their company or department. |
| Churn | Important target customers churn. |
For properly onboarded customers, the churn rate is close to zero. You get “Thank you, you made my life so much better!” postcards (really!) |
|
Inbound Leads |
All customers come from outbound. They are mostly buddies. You lose most customers along the sales process. |
You’re getting an increasing amount of high-quality inbound leads. Word of mouth is spreading. |
A lot of sales KPIs do not leave any room for interpretation and are
directly linked to the value of your company, e.g. the revenue. We like to have
a close look on these criteria, when the start-up is mature enough and has already
products in productive use. From Series A onwards investors will look even
closer.
Conclusion
After presenting all these
indicators, the bad news is: There is no single indicator or mathematical formula
that predicts product-market fit with certainty.
However, these indicators were derived from our VC-experience and help us to evaluate
a start-up from different angles at different points in time. The provided
insights are very valuable for our investment decisions. On top of that, the
presented framework provides guidance in the strategic discussions that we have
every day with our portfolio companies.
We would love to hear your
thoughts about these indicators! Do you use other criteria that are not
displayed here? Which ones do you think matter most? Please comment!
In the next part of this blog we will present the
customer development process that we found to be very helpful in our work with
portfolio companies on the way to Product-Market Fit. Stay tuned!

Successful pitches: 10 tips for an impressive pitch deck

Digital health investments: Road to success requires bold steps and an interdisciplinary approach